
Most used app per country
By calculating the reach[1] of the apps used by our participants, we can put together a list of the apps used by the highest amount of people in various categories per country.
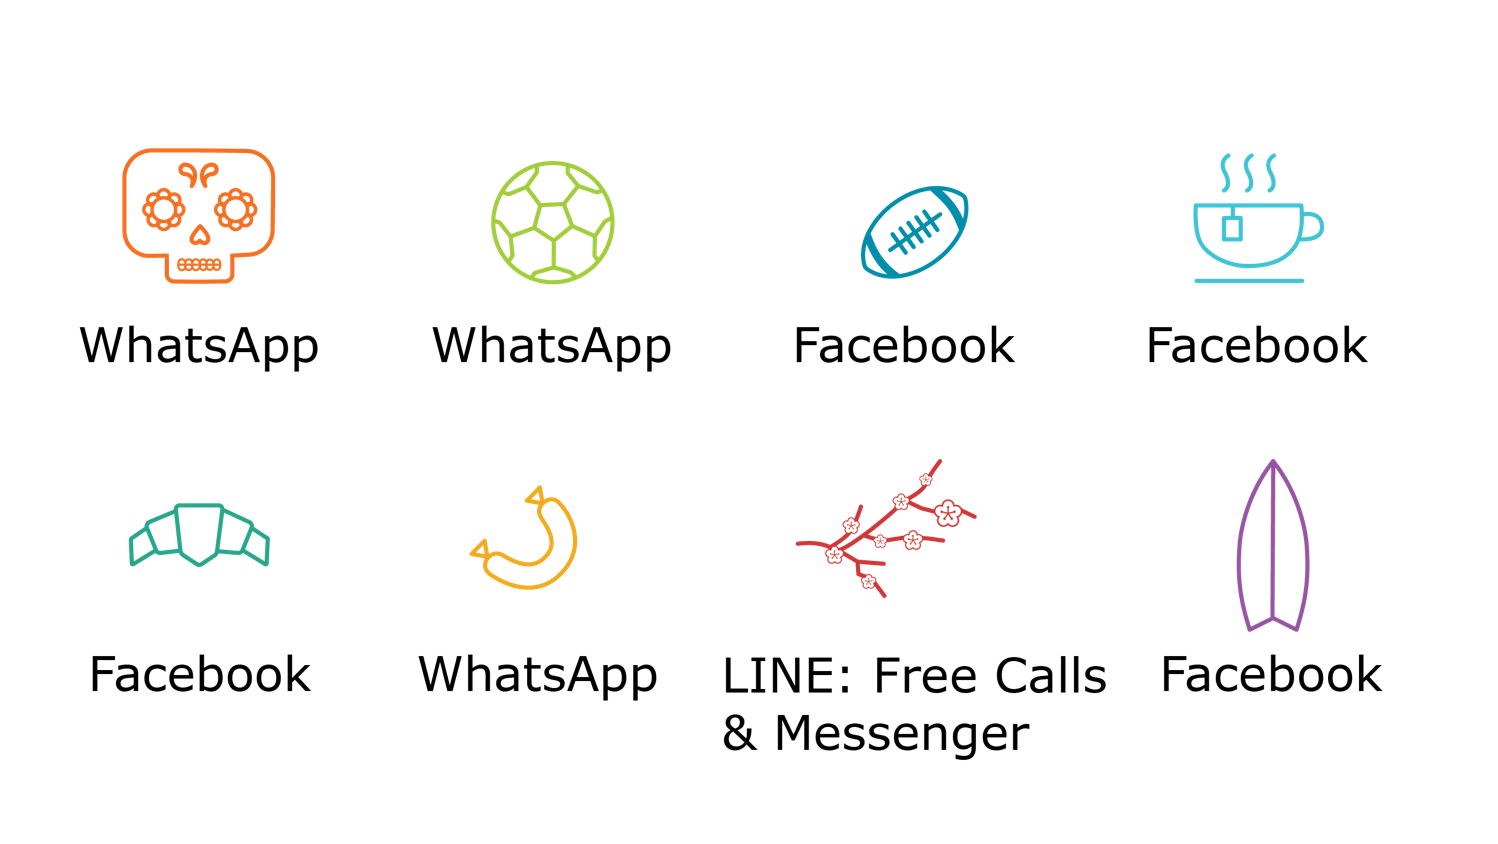
Social apps dominate this category, with every country except Japan having the highest reach on either Facebook or WhatsApp. Line, which is big in Japan, is also a social and messaging app.
Most used gaming app per country
Using the same approach as above, but adding categorization, we can also find the most gaming app used by the most amount of participants per country.
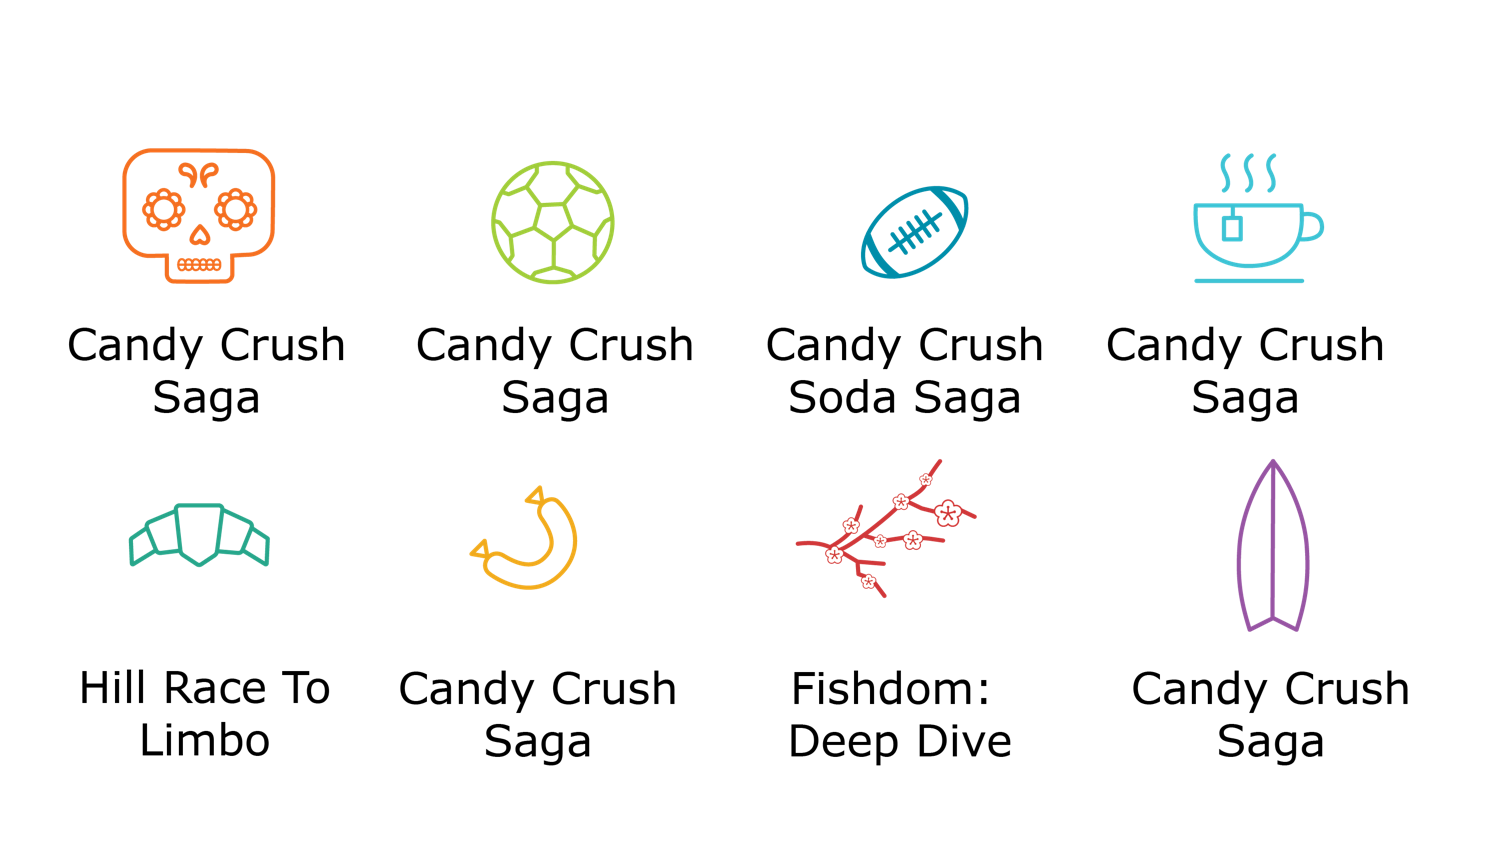
Again, there is not a huge difference between the countries, with Candy Crush Saga clearly coming out on top in every country except France and Japan. It is worth noting that the Japanese game, Fishdom, has similar gaming features to Candy Crush Saga. France is the only country with a racing game as their top used gaming app.
Most popular YouTube search per country
Since our technology also tracks search queries (which are extractable from the URL), we can create the following ranking of the most frequently searched teams.
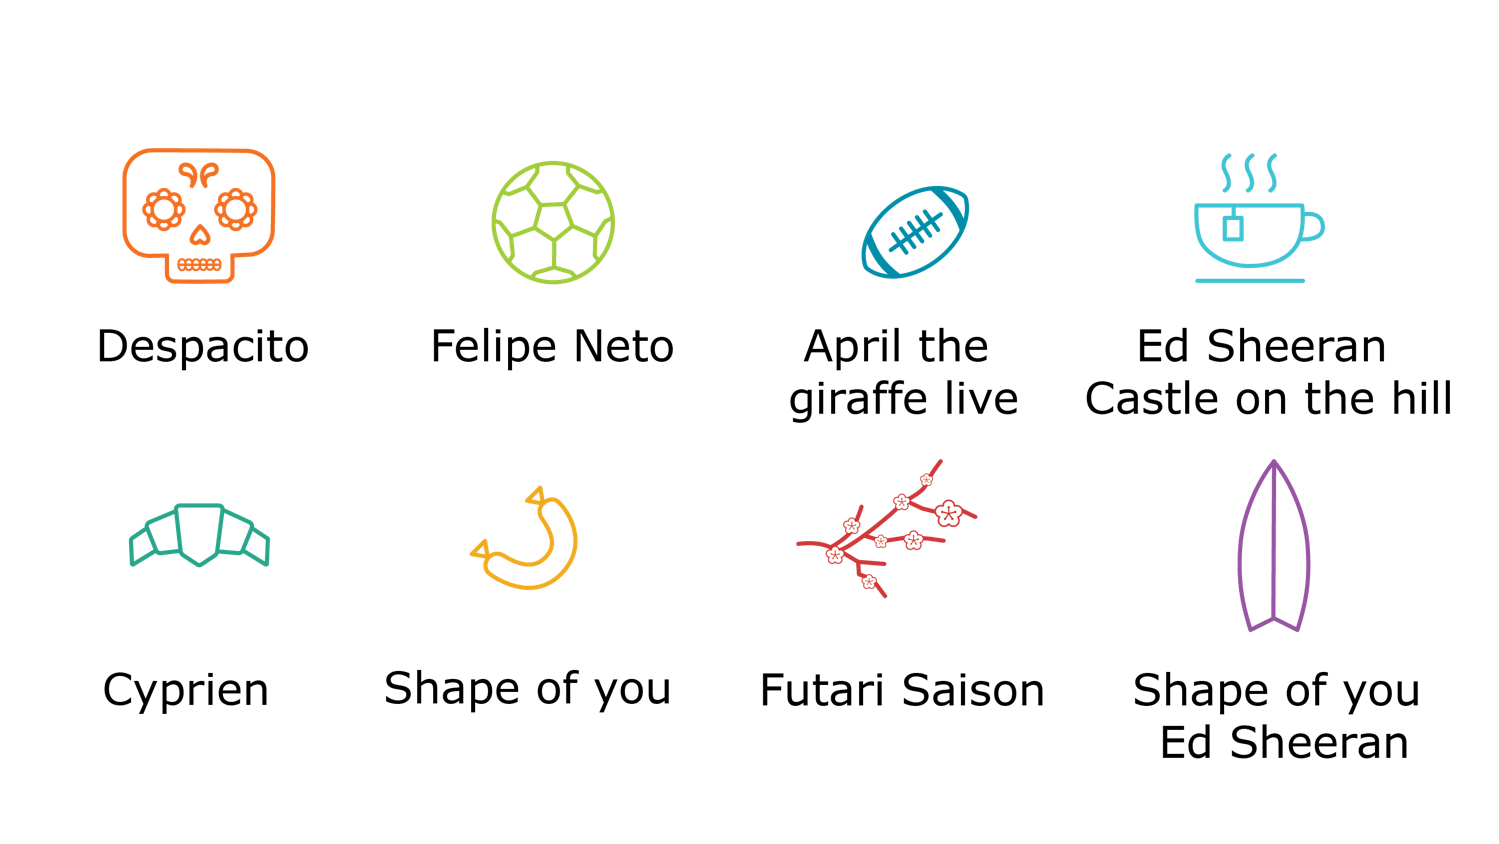
For Mexico, Despacito is a song by artist Luis Fonsi, which was very popular in Latin America around the time of our study. In Brazil, Felipe Neto is a YouTube ‘star’ with over 10 million subscribers. In the US, ‘April the giraffe live’ refers to a livestream of a giraffe in the late stages of pregnancy and subsequent birth, which was broadcast live on YouTube throughout February and March.
The top search terms of the UK, Germany and Australia all relate to the first two singles from British singer Ed Sheeran’s latest album, ’Shape of You’ and ‘Castle on the Hill’. Those songs were released in January 2017 and broke records in a number of countries, including the UK, Australia and Germany. For France, Cyprien is a popular French YouTube ‘star’, also with over 10 million subscribers. The Japanese search term refers to a song by the Japanese girl group Keyakizaka46 called Futari Saison. It reached number 1 on the Japanese Top 100 Billboard Charts, and broke sales records for the first time in 20 years.
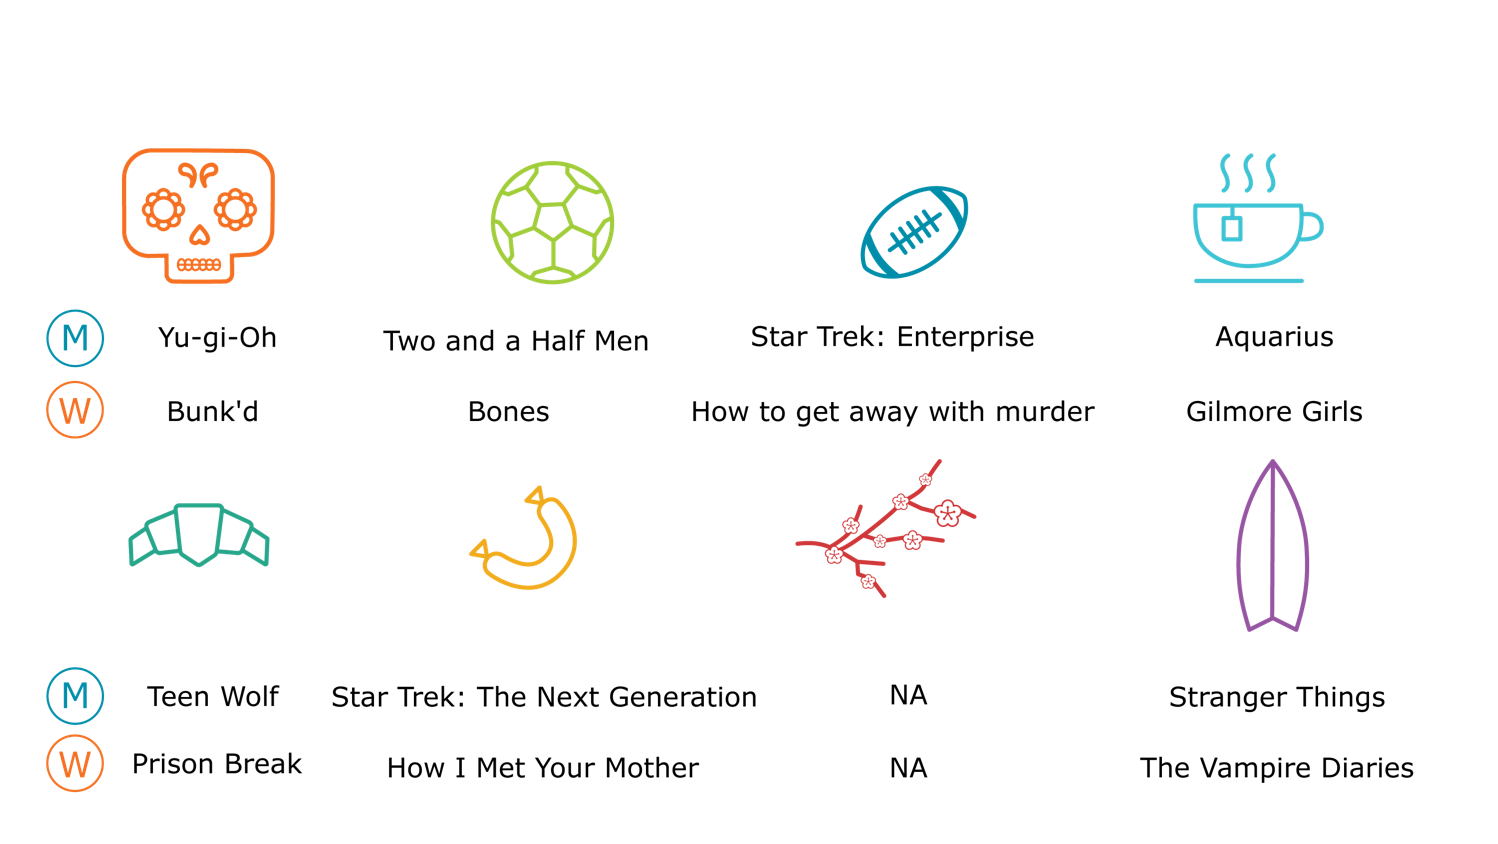
Most watched Netflix series per country
Using the series ID we identified from the Netflix URLs that our users visited, we are also able to find out which Netflix series were most popular for which countries. 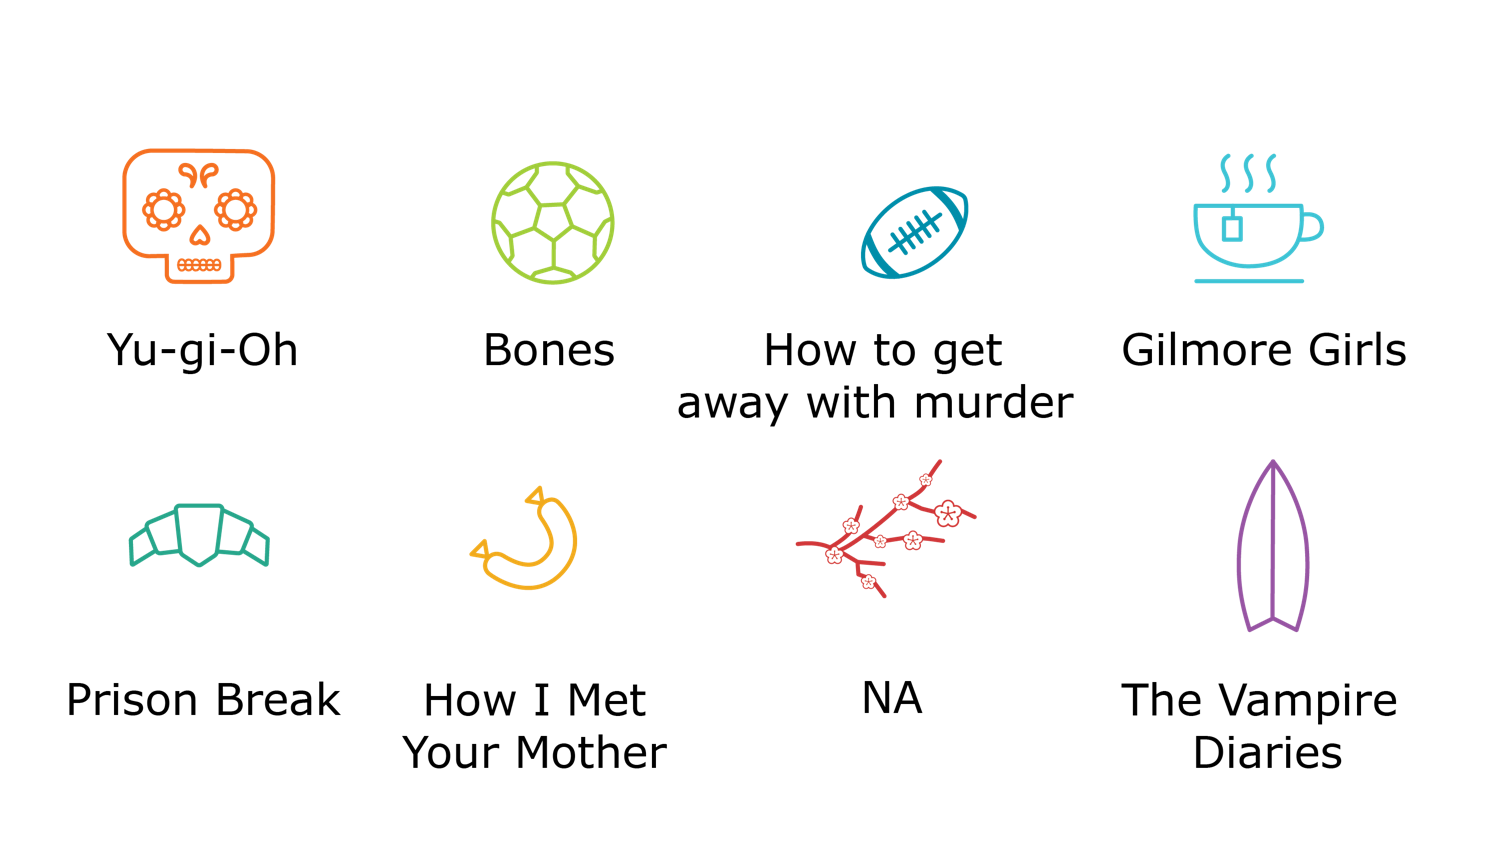 The only country we didn't select a most watched Netflix series for was Japan, because it was used too infrequently to identify a series that was most watched.
We also segmented the data to look at the most popular Netflix show per gender.
Most visited news landing page
With our categorization, we can easily pick out the most visited domain per website category. For example, we identified the top visited news landing page per country.
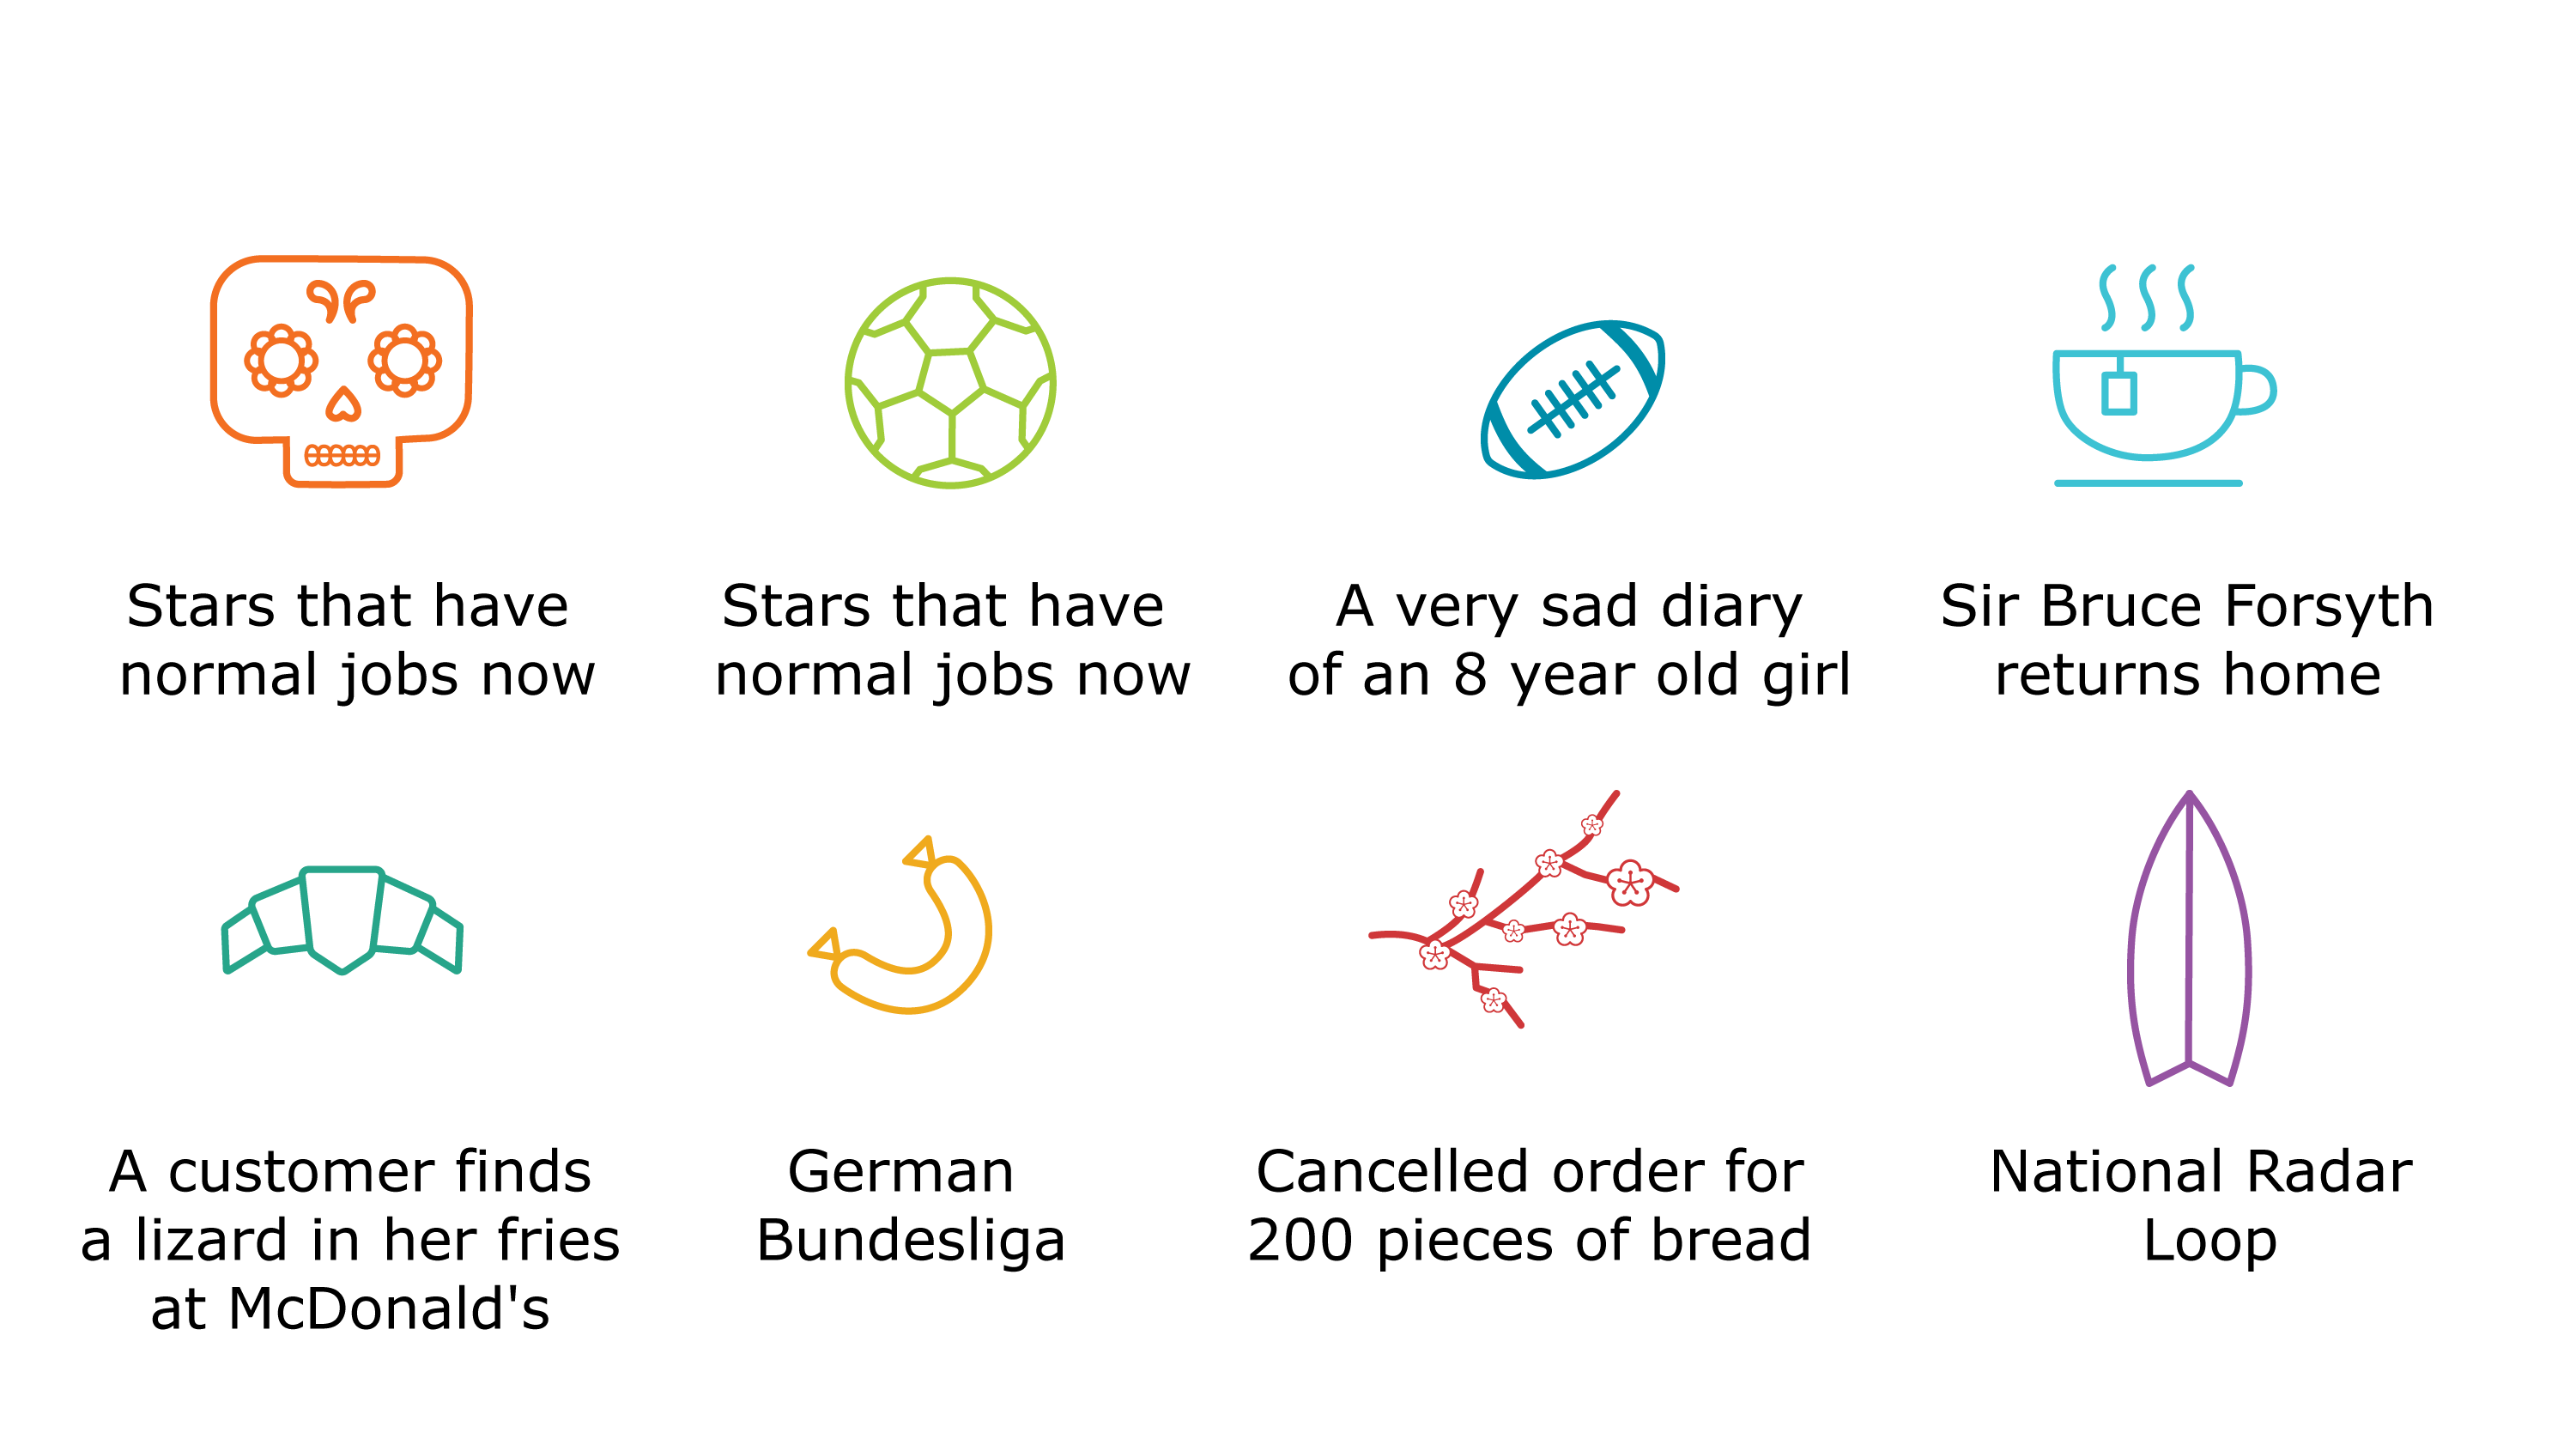
The article for Mexico and Brazil was the same, but with different translations. In Australia, the most visited news page showed a weather map, which is understandable, since there was an heat wave in the country during our study.
Average number of pageviews per shopping session
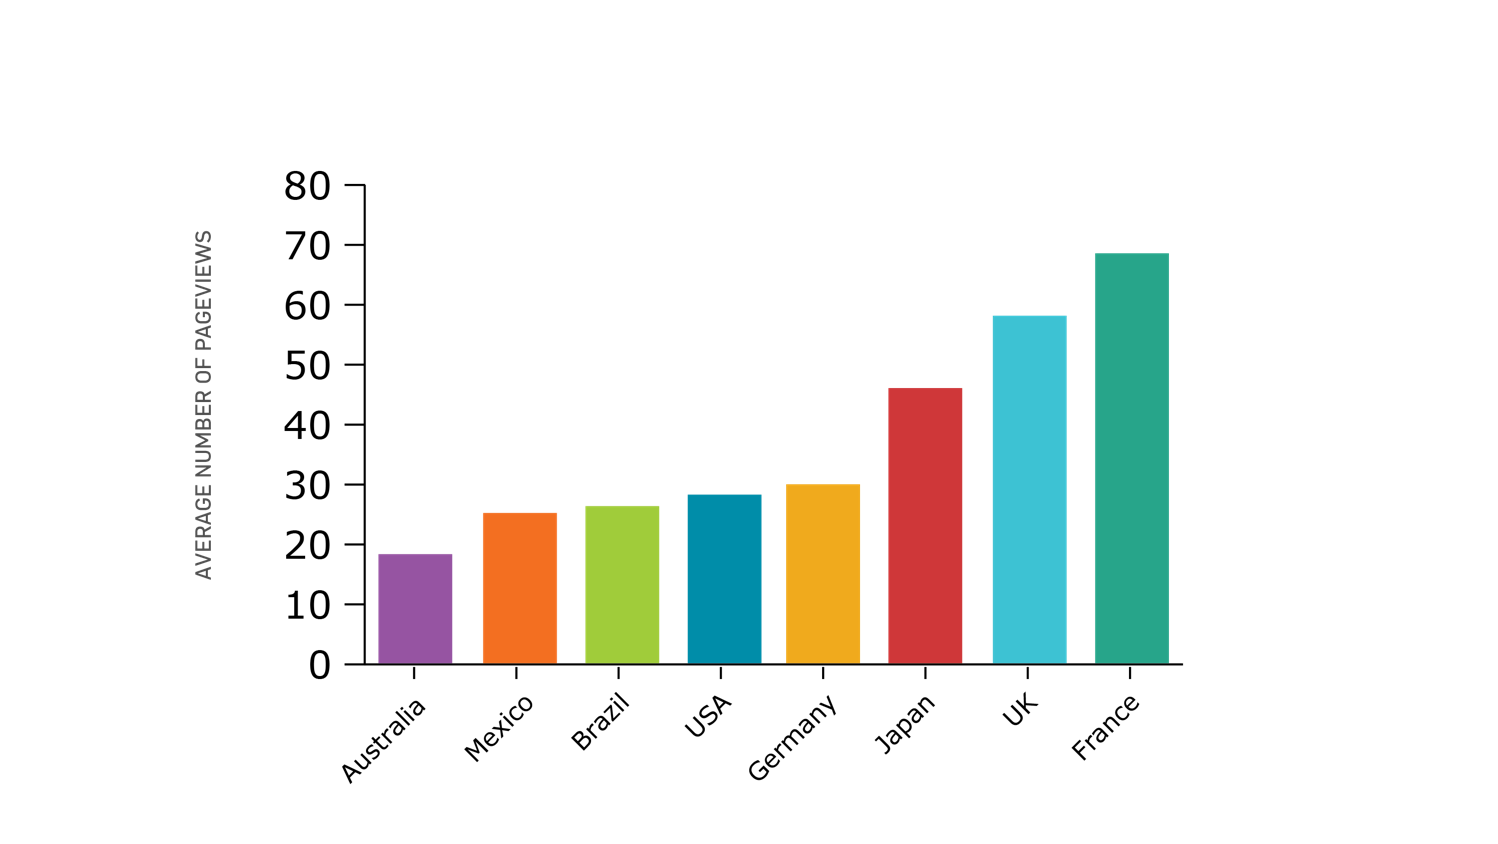
The above graph shows the average number of pageviews per session when a shopping site is visited. We can conclude that in France, consumers spend a lot of time per session looking into products, perhaps using various websites for comparison. Australia, on the other hand, only visits on average 18 different pages in a shopping session.
Conclusion
We think the best way to visualize exactly what we mean when we talk about the power of behavioral data is by using this iceberg.
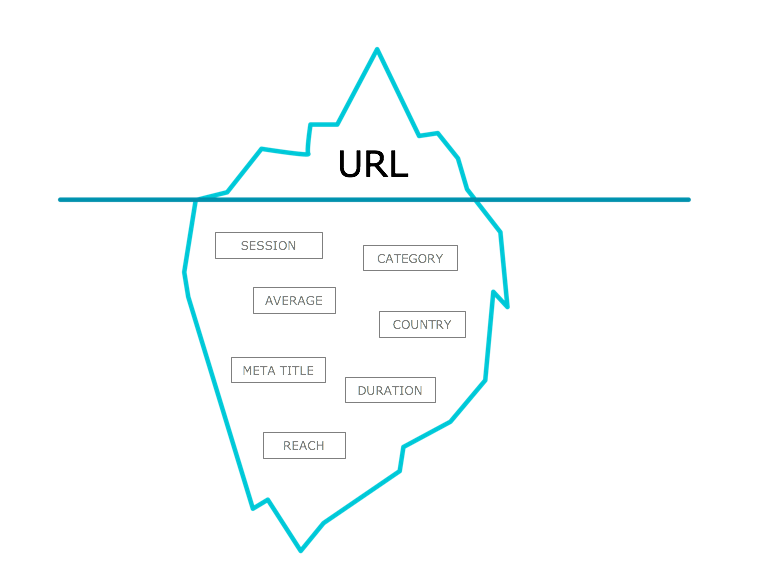
The visible part of the iceberg is the URL. This is the foundation of what we do – we passively collect behavioral data in the form of URLs, then adding identifiers in the form of timestamps and user IDs.
Even just adding simple components such as demographic data, or combining behavioral data with in-the-moment and post-surveys, can reveal invaluable insights into customer segments and customer journeys across the entire globe. Measuring and analyzing who (age, gender, etc.) browses what (websites, apps, search terms), where (country, category, device), and when (time, duration, frequency) helps us to improve the understanding of consumers’ online behavior. This understanding can be used to improve customer experiences (through better targeting and communication) as well as to refine products and services.
[1] Reach refers to the total number of different people or households exposed, at least once, to a domain during our observational period.